Skip to the photographs
RUWAIDIX
Research notebook / new archival photographs

From the workbench to the conference floor.

Plots from humidity-sensing trials, droplets seen from the side, and the people and presentations around a 2017 scientific meeting. The instruments and the questions have changed over the years; the habit of keeping the original record has not.

ARCHIVAL MATERIALS · ADDED 17 OCTOBER 2026
01 / experimental signals

When humidity changes an electrical measurement

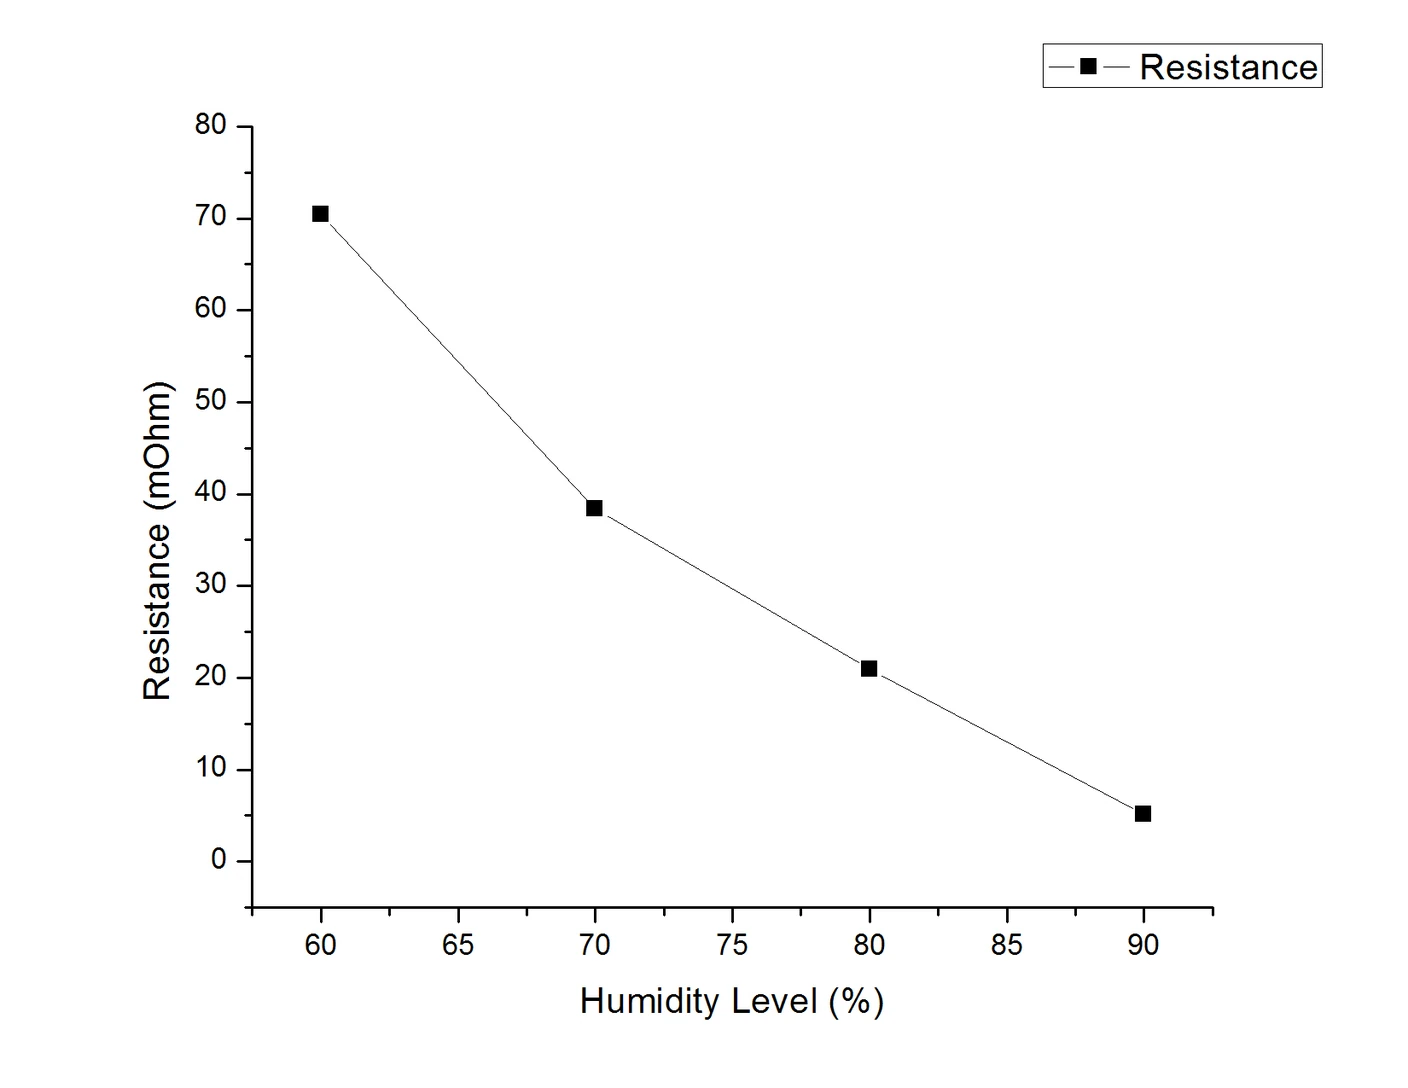
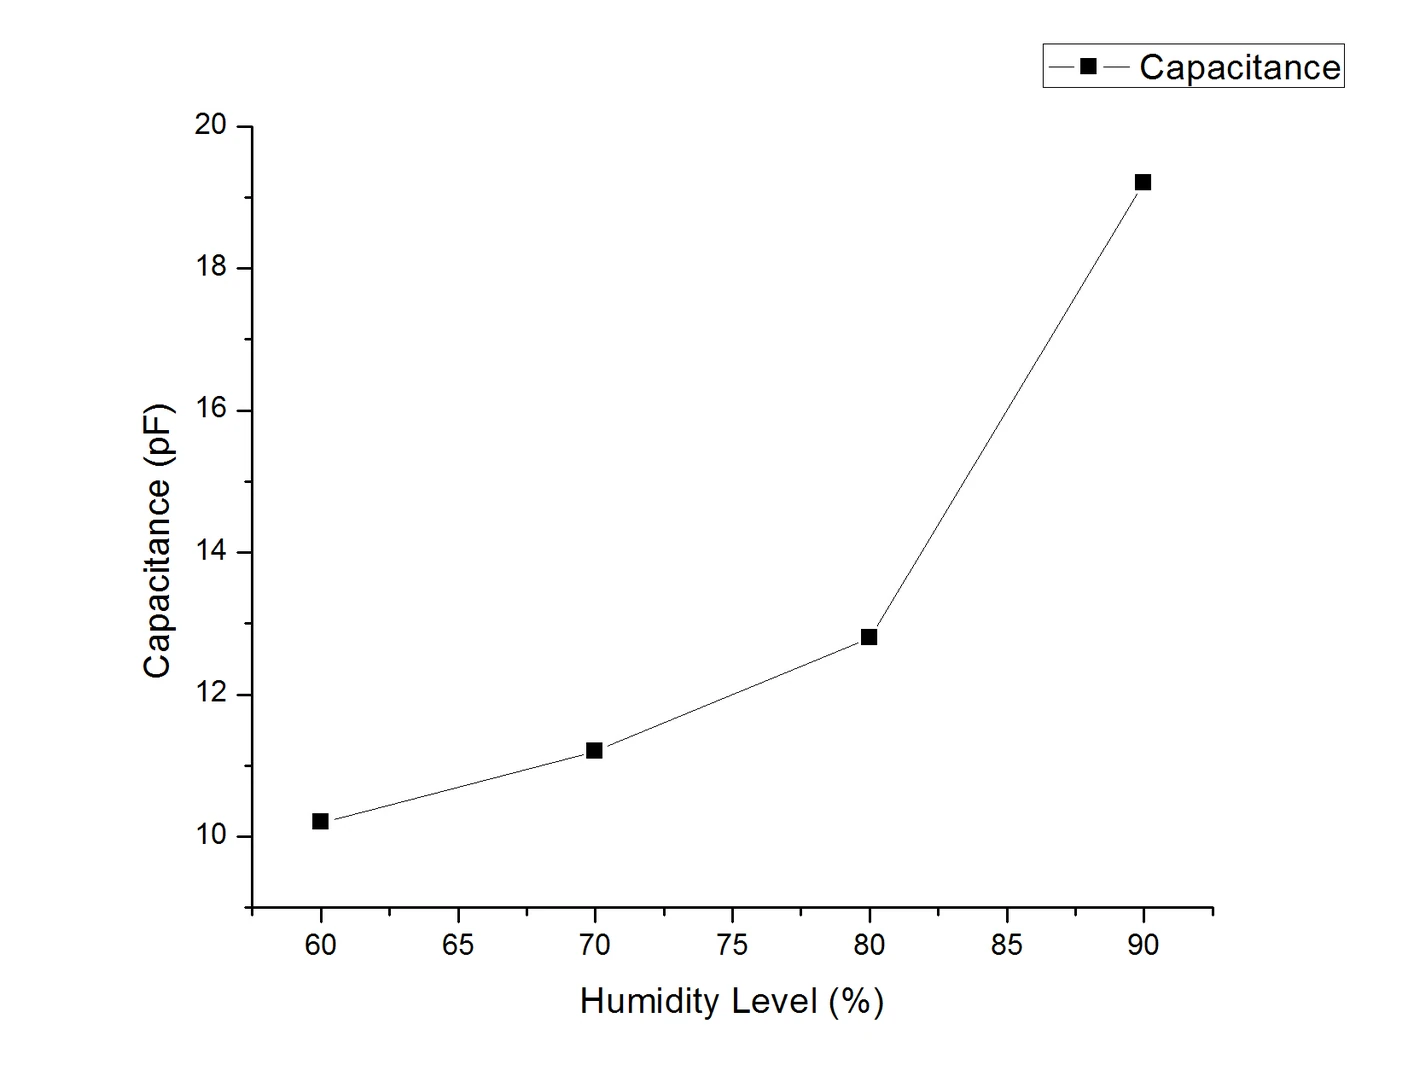
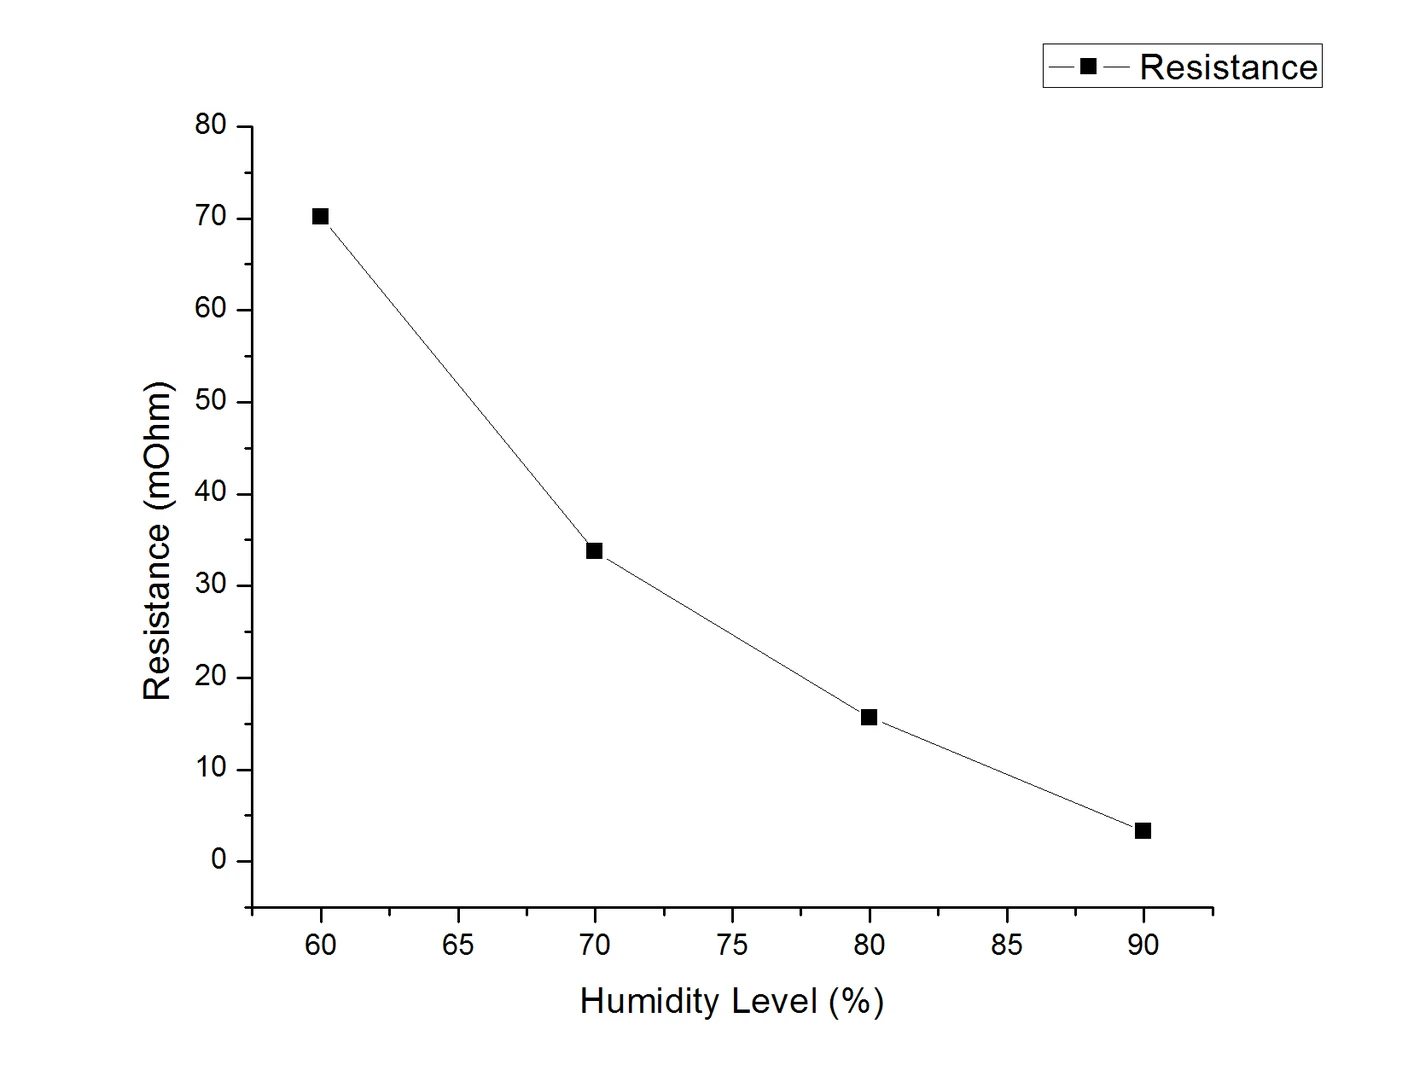
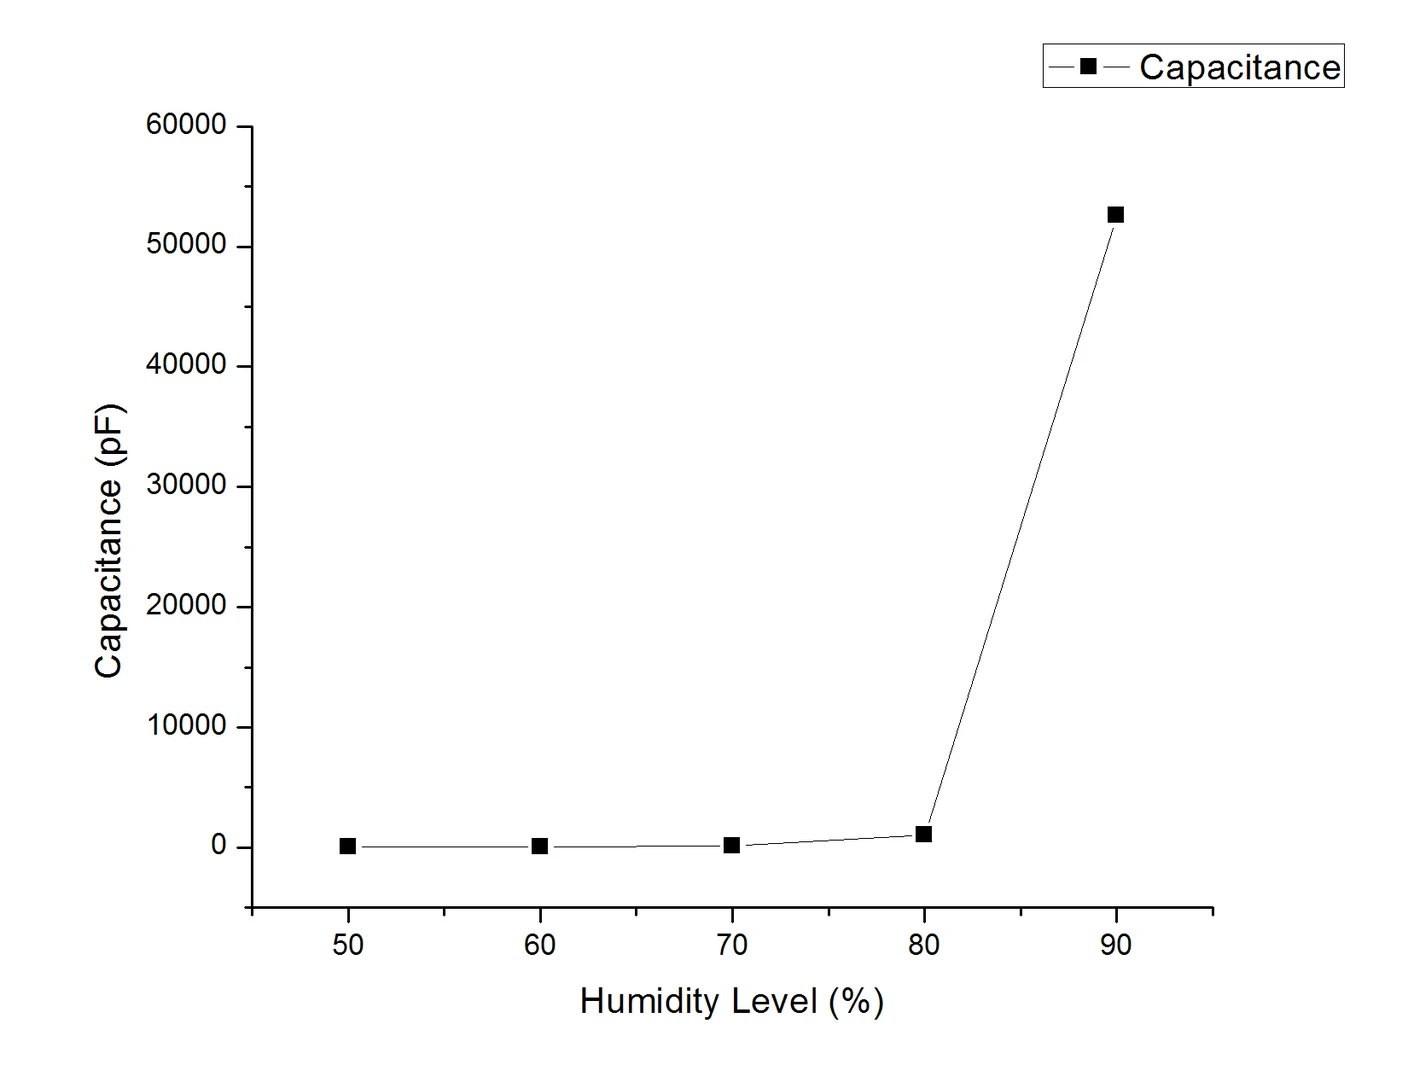
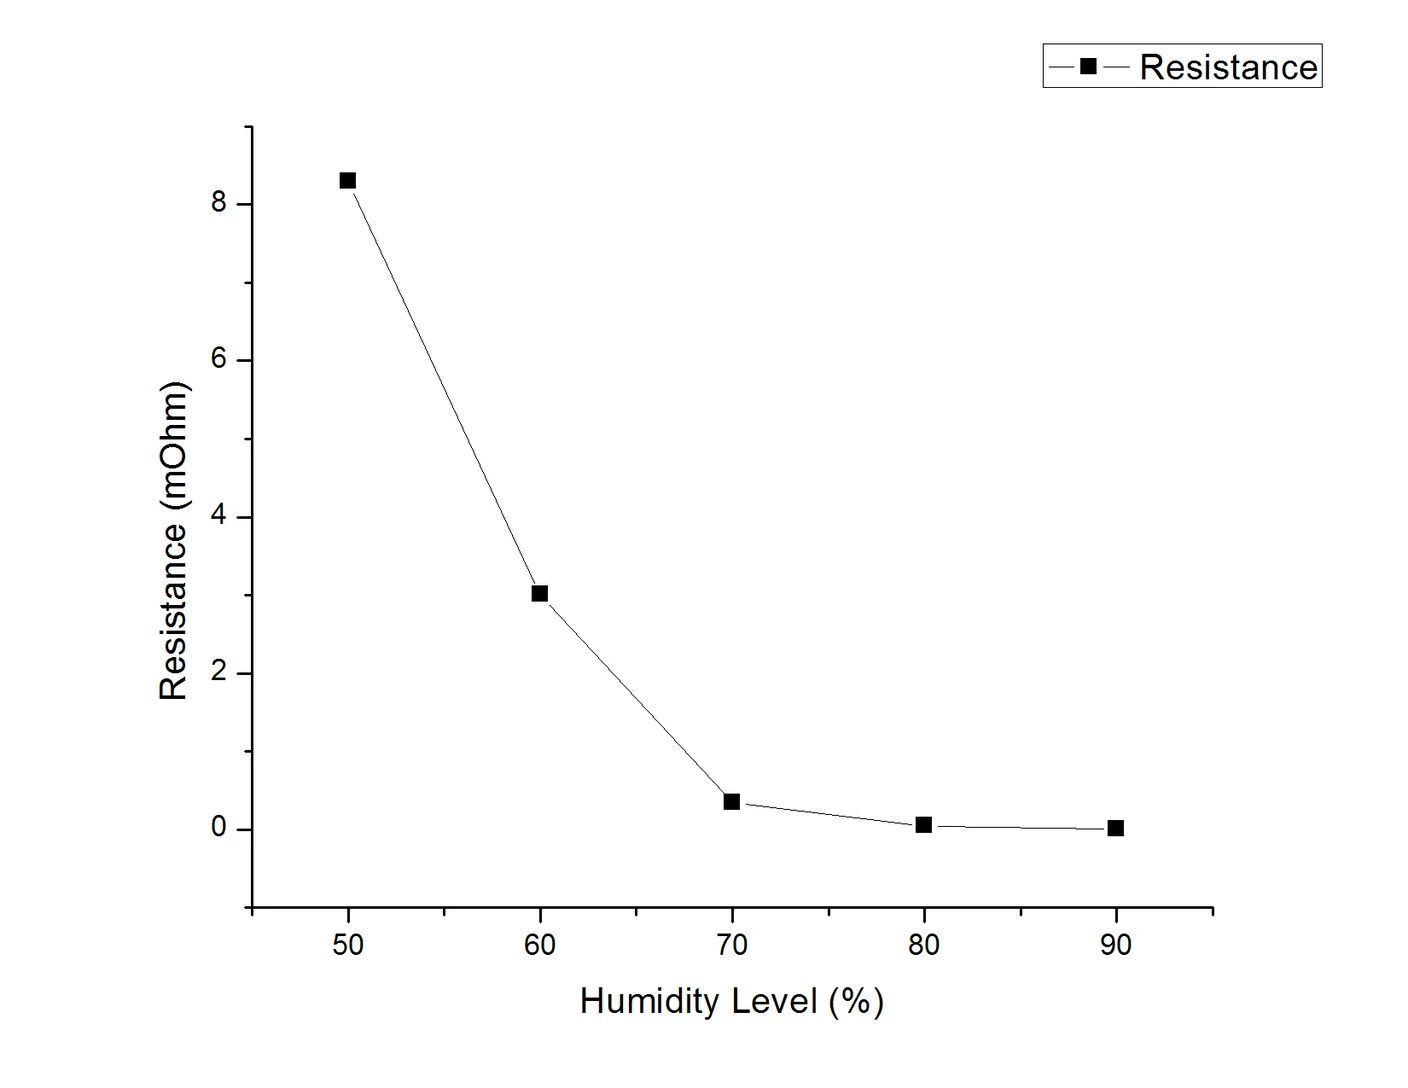
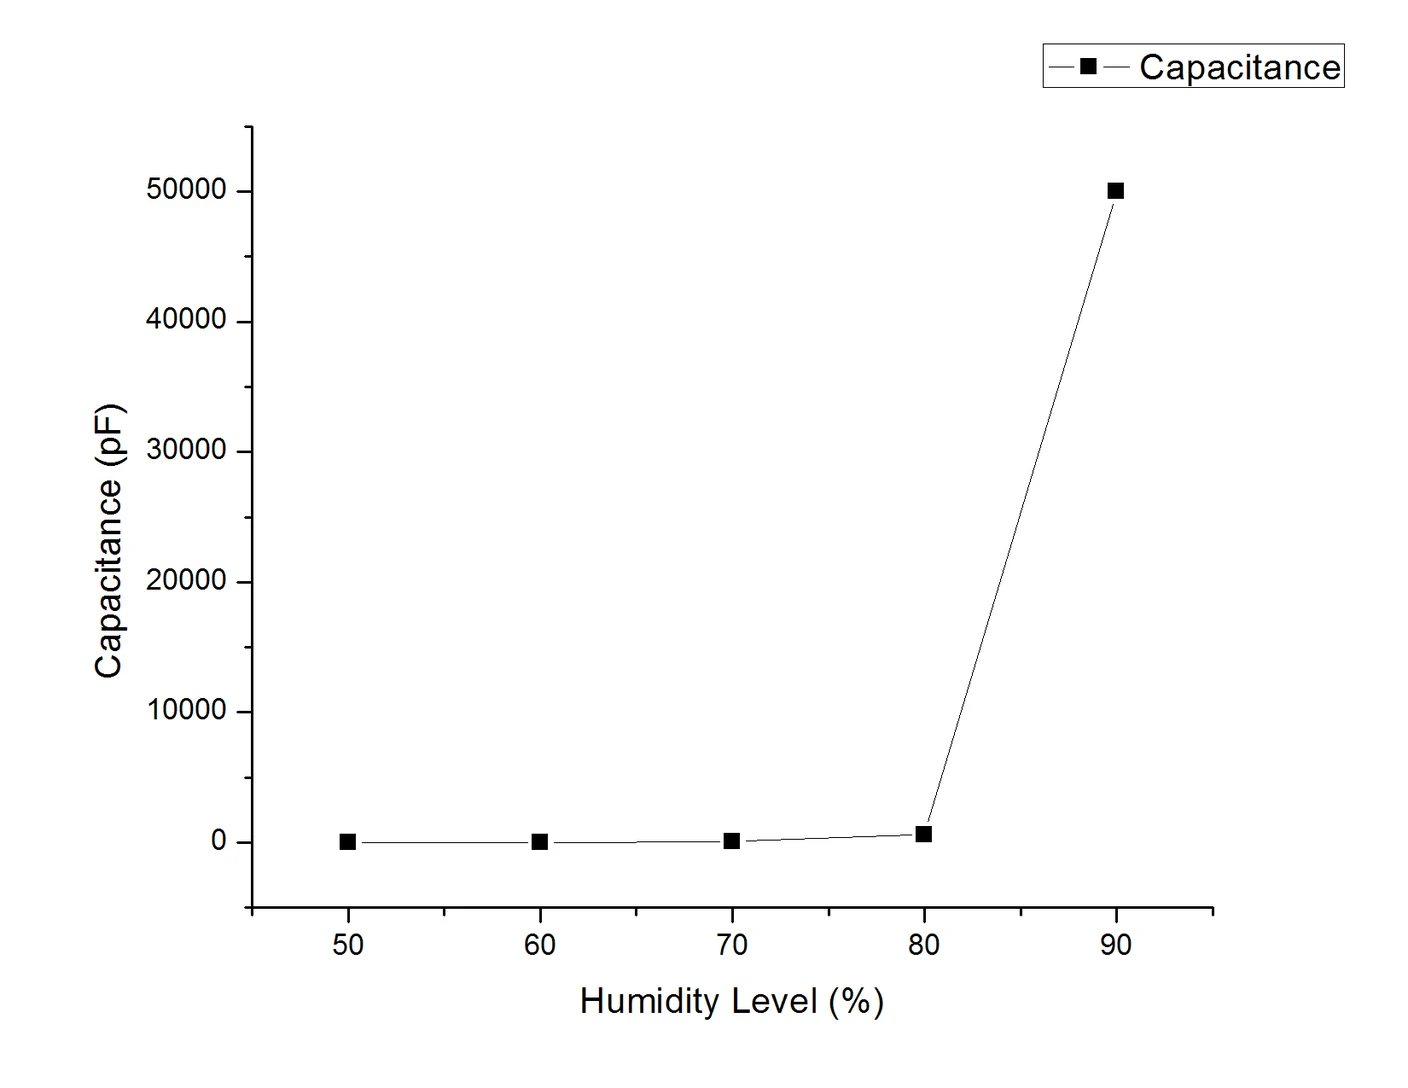
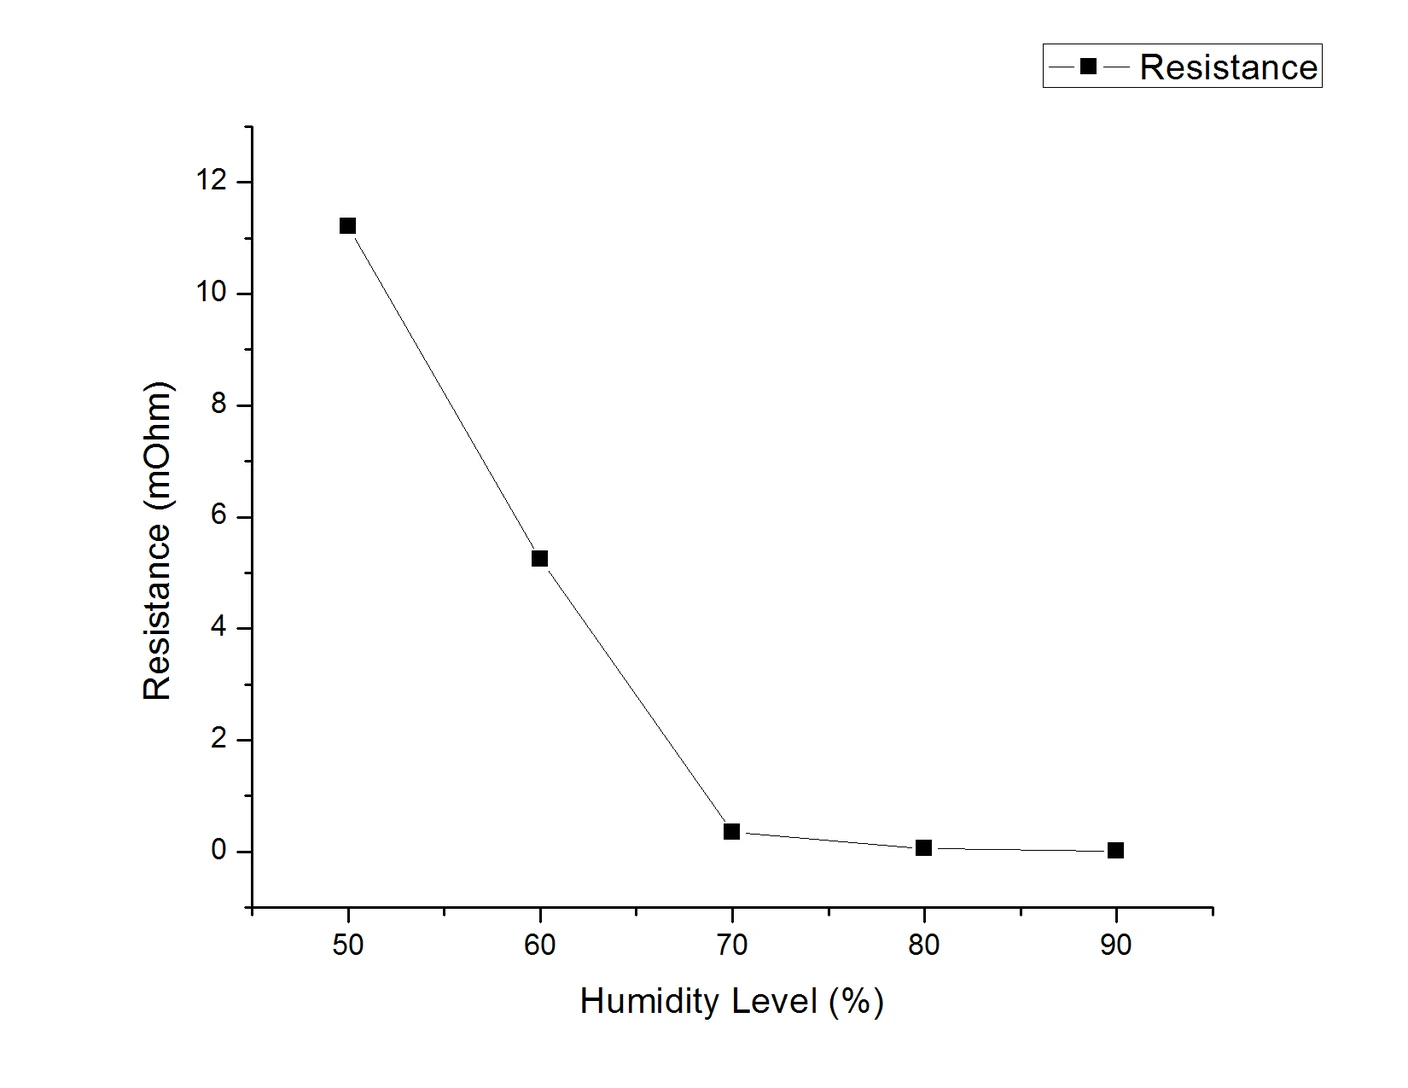
Four sets of uploaded titanium dioxide (TiO₂) trial plots trace capacitance and resistance against relative humidity. The curves show pronounced shifts as humidity rises, especially in the thick-film capacitance records at 90%. The original figures are retained rather than smoothed into a single persuasive line. The filenames distinguish “Neutral” and “Thick” TiO₂, but do not provide fabrication details, electrode geometry, replicate statistics or an independently checked sensor-calibration procedure.

Neutral TiO₂ · Trial 1
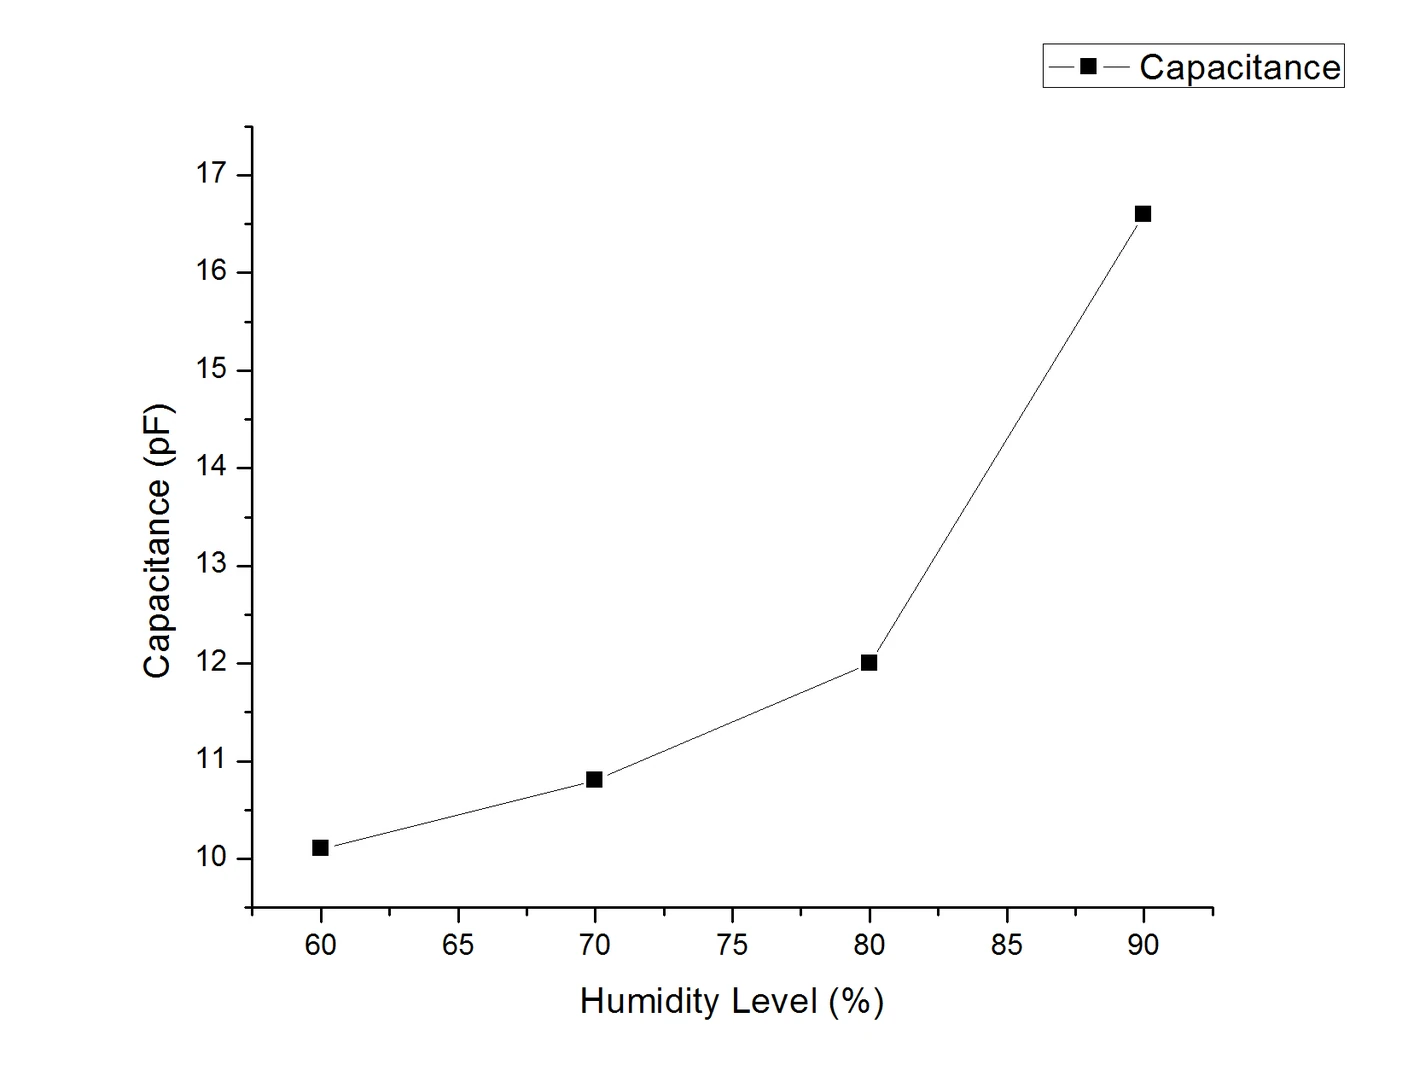
Source plot of capacitance versus the humidity levels labelled in the uploaded trial; the measurement axis and units are retained from the original image.
Capacitance · Neutral TiO₂ · Trial 1Source plot of capacitance versus the humidity levels labelled in the uploaded trial; the measurement axis and units are retained from the original image.
Source plot of resistance versus the humidity levels labelled in the uploaded trial; the measurement axis and units are retained from the original image.
Resistance · Neutral TiO₂ · Trial 1Source plot of resistance versus the humidity levels labelled in the uploaded trial; the measurement axis and units are retained from the original image.

Neutral TiO₂ · Trial 2

Source plot of capacitance versus the humidity levels labelled in the uploaded trial; the measurement axis and units are retained from the original image.
Capacitance · Neutral TiO₂ · Trial 2Source plot of capacitance versus the humidity levels labelled in the uploaded trial; the measurement axis and units are retained from the original image.
Source plot of resistance versus the humidity levels labelled in the uploaded trial; the measurement axis and units are retained from the original image.
Resistance · Neutral TiO₂ · Trial 2Source plot of resistance versus the humidity levels labelled in the uploaded trial; the measurement axis and units are retained from the original image.

Thick TiO₂ · Trial 2

Source plot of capacitance versus the humidity levels labelled in the uploaded trial; the measurement axis and units are retained from the original image.
Capacitance · Thick TiO₂ · Trial 2Source plot of capacitance versus the humidity levels labelled in the uploaded trial; the measurement axis and units are retained from the original image.
Source plot of resistance versus the humidity levels labelled in the uploaded trial; the measurement axis and units are retained from the original image.
Resistance · Thick TiO₂ · Trial 2Source plot of resistance versus the humidity levels labelled in the uploaded trial; the measurement axis and units are retained from the original image.

Thick TiO₂ · Trial 3

Source plot of capacitance versus the humidity levels labelled in the uploaded trial; the measurement axis and units are retained from the original image.
Capacitance · Thick TiO₂ · Trial 3Source plot of capacitance versus the humidity levels labelled in the uploaded trial; the measurement axis and units are retained from the original image.
Source plot of resistance versus the humidity levels labelled in the uploaded trial; the measurement axis and units are retained from the original image.
Resistance · Thick TiO₂ · Trial 3Source plot of resistance versus the humidity levels labelled in the uploaded trial; the measurement axis and units are retained from the original image.

The resistance plots retain their original axis label, mOhm; this notation requires checking against the laboratory record before unit conversion or quantitative comparison. The large increase in thick-film capacitance at 90% humidity may warrant further examination, but these plots alone cannot establish whether it reflects bulk dielectric response, surface conduction, a measurement-range transition or another effect. No regression, error bars or performance claim have been invented.

02 / the liquid-solid interface

Three views of a drop

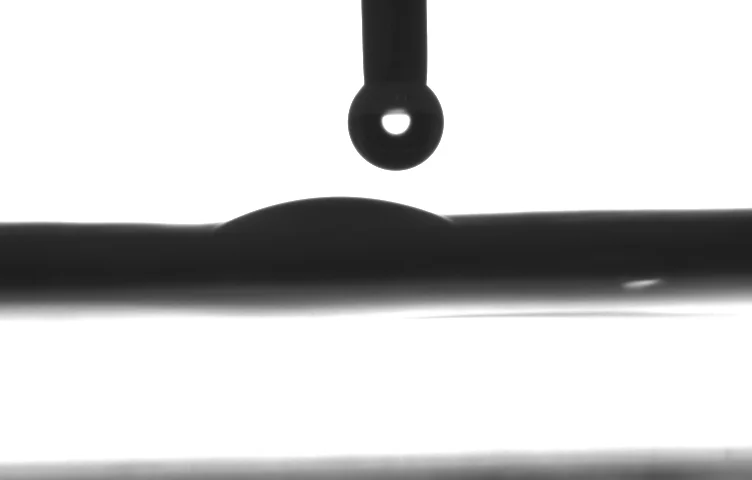
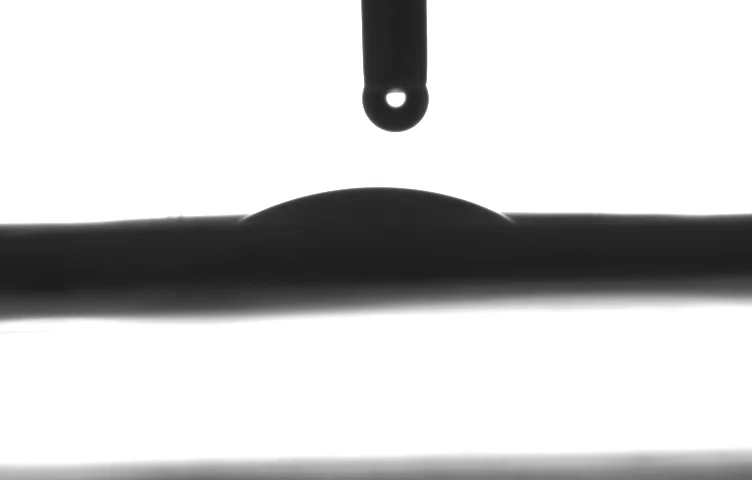
The supplied black-and-white images show a liquid dispenser and side-on droplet profiles at a surface. Those outlines are useful for thinking about wetting and contact geometry. The image names do not establish liquid composition, surface treatment, advancing or receding contact angle, or a numerical result.
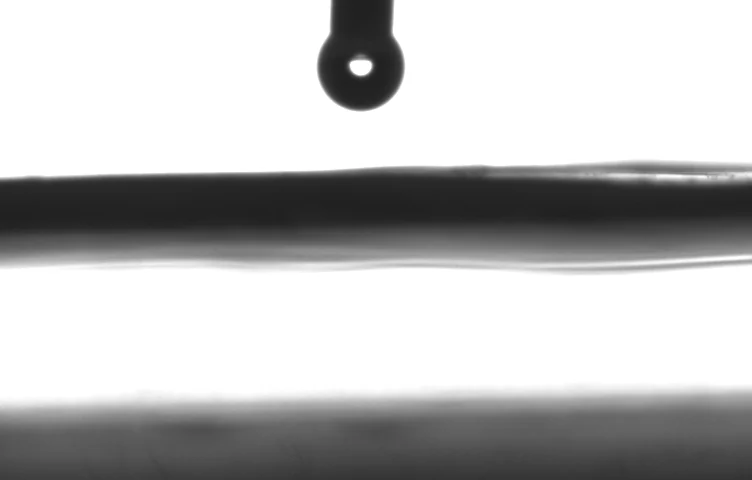
Side-on droplet profile labelled FM2; the image shows a dispenser above a horizontal surface.
FM2Side-on droplet profile labelled FM2; the image shows a dispenser above a horizontal surface.
Side-on droplet silhouette labelled W1. No contact-angle value is embedded in the supplied image.
W1Side-on droplet silhouette labelled W1. No contact-angle value is embedded in the supplied image.
Side-on droplet silhouette labelled W2. No contact-angle value is embedded in the supplied image.
W2Side-on droplet silhouette labelled W2. No contact-angle value is embedded in the supplied image.
03 / moving archive

Five seconds in the laboratory

This short vertical clip shows a researcher seated beside laboratory equipment. It is a personal moving-image record of a working environment; there is no experiment, result or individual identity assigned beyond what the footage establishes.

Archival video / 5.7 seconds / visual record, not a recorded experiment

04 / Washington, 2017

The chemistry around the poster

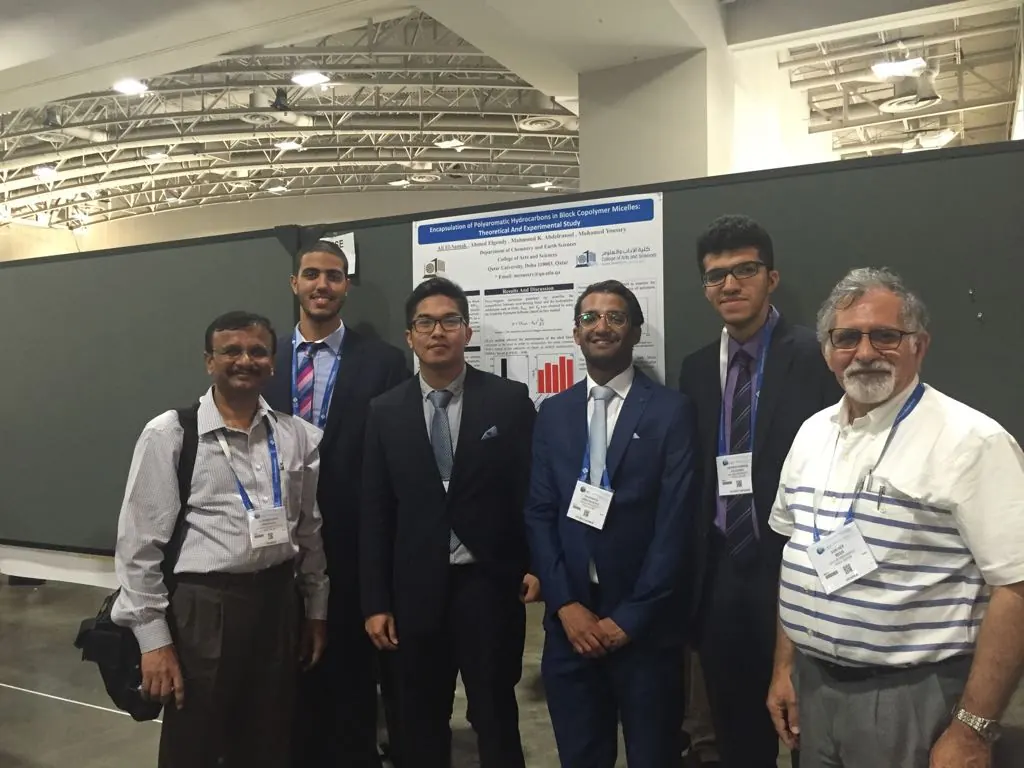
Conference photographs can be rather revealing when kept alongside the research. The posters concerned natural dyes for anion sensing and the encapsulation of polycyclic aromatic hydrocarbons in block copolymer micelles. Other photographs show the Qatar University delegation, the chemistry-lesson record attempt and the conversations that went on away from the presentation boards. These belong to the wider history of the student chemistry community, not merely to a list of attendances.
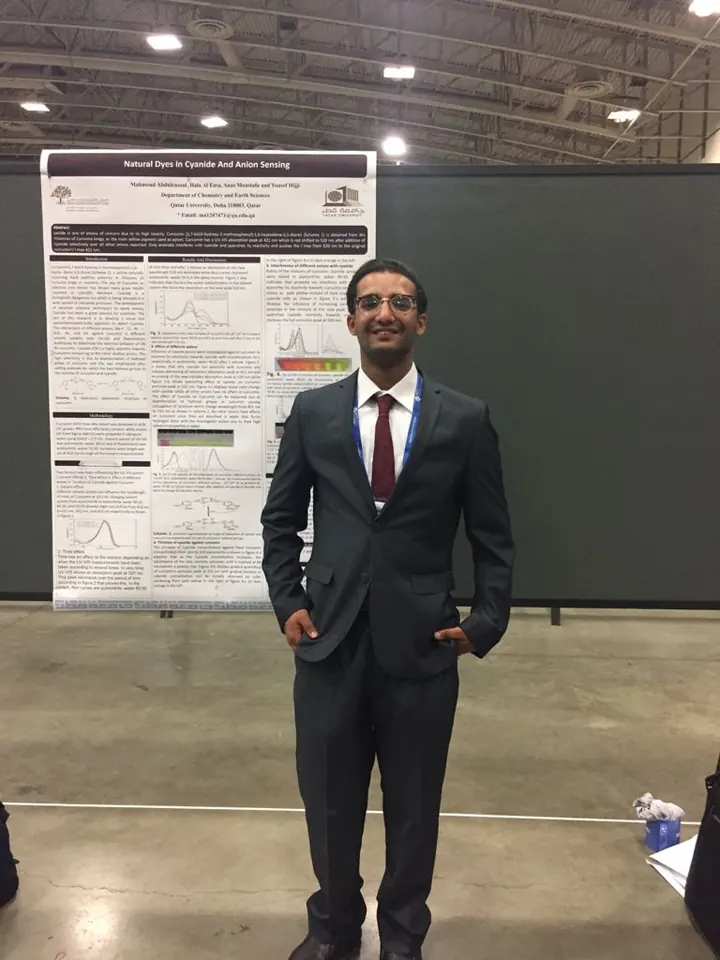
Poster display for a study titled “Natural Dyes in Cyanide and Anion Sensing”. Visible at the 2017 scientific meeting.
Natural dyes and anion sensingPoster display for a study titled “Natural Dyes in Cyanide and Anion Sensing”. Visible at the 2017 scientific meeting.
I appear with colleagues in front of our poster, “Encapsulation of Polycyclic Aromatic Hydrocarbons in Block Copolymer Micelles: Theoretical and Experimental Study”.
Block copolymer micellesI appear with colleagues in front of our poster, “Encapsulation of Polycyclic Aromatic Hydrocarbons in Block Copolymer Micelles: Theoretical and Experimental Study”.
Delegation photograph with Qatar University and Qatar flags near the Guinness World Records attempt signage. Participation in an attempt is not evidence of a record being awarded.
The chemistry lesson attemptDelegation photograph with Qatar University and Qatar flags near the Guinness World Records attempt signage. Participation in an attempt is not evidence of a record being awarded.
Participants with Qatar University and Qatar flags at the ACS venue.
Qatar University at ACSParticipants with Qatar University and Qatar flags at the ACS venue.
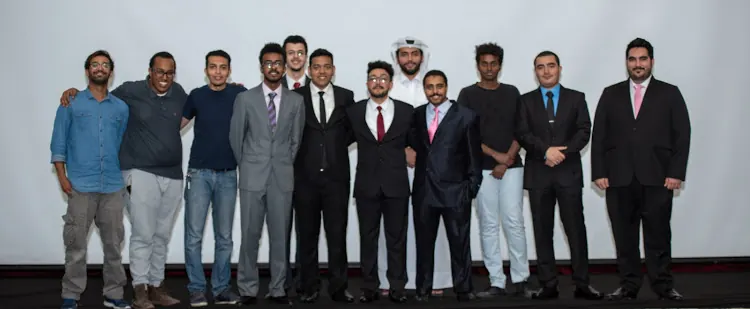
Group photograph from the 2017 ACS archive. Individual identities are not inferred from the photograph.
A meeting during the conferenceGroup photograph from the 2017 ACS archive. Individual identities are not inferred from the photograph.
Informal group photograph from the August 2017 archive.
Outside the conference hallInformal group photograph from the August 2017 archive.
Me with Prof. Jan Kwak and other participants at the astrochemistry event, as identified from my personal archive.
With Prof. Jan Kwak at the astrochemistry eventMe with Prof. Jan Kwak and other participants at the astrochemistry event, as identified from my personal archive.